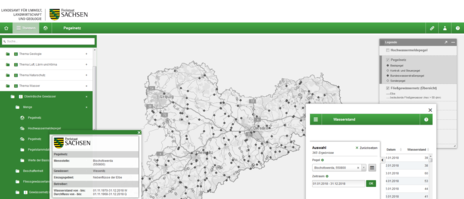
Aktuelle Wasserstände
Aktuelle Hochwasserwarnungen
Zurzeit liegen keine Hochwasserwarnungen vor.
Aktueller Pegelstatus
| Flussgebiet | Status der Meldepegel |
|---|---|
| Elbestrom | Niedrigwasser: 4 |
| Nebenflüsse Obere Elbe | Kein Hochwasser: 10 Niedrigwasser: 11 |
| Nebenflüsse Mittlere Elbe | Kein Hochwasser: 1 Niedrigwasser: 2 |
| Schwarze Elster | Kein Hochwasser: 4 Niedrigwasser: 5 |
| Mulde | Kein Hochwasser: 24 Niedrigwasser: 11 |
| Obere Weiße Elster | Kein Hochwasser: 6 Niedrigwasser: 1 |
| Untere Weiße Elster | Kein Hochwasser: 2 Niedrigwasser: 4 |
| Spree | Kein Hochwasser: 8 Niedrigwasser: 5 |
| Lausitzer Neiße | Kein Hochwasser: 2 Niedrigwasser: 4 |
Informationen dazu finden Sie auf unseren Seiten im Abschnitt Alarmstufen und Hochwassermeldepegel.
Warnübersicht
Hochwasserwarnungen

Hochwasserfrühwarnung

Wetterwarnungen
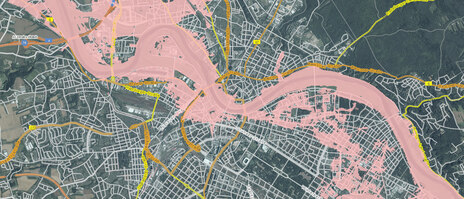
Es gibt unterschiedliche Warnungen vor der Naturgefahr »Hochwasser«. Hochwasser kann sehr lokal (in einzelnen Ortsteilen beispielsweise), regional (in kleineren Bächen und Flüssen) oder überregional (wie beim Hochwasser 2013 oder 2002) auftreten.
Zur Einschätzung der überregionalen Hochwassergefährdung nutzen Sie die Hochwasserwarnungen des Landeshochwasserzentrums, welche auf beobachteten Wasserständen an den Hochwassermeldepegeln sowie hydrologischen Vorhersagen basieren.
Für die Warnungen vor regionalem Hochwasser eignet sich die auf dieser Seite zu findende Hochwasserfrühwarnung des Landeshochwasserzentrums. Sie bietet eine ungefähre Abschätzung der zu erwartenden Hochwassergefährdung für kleine Einzugsgebiete für bis zu 24 Stunden im Voraus.
Lokale Hochwasser können sich sehr rasch in Folge von Starkregen entwickeln und sind sehr schwer hinsichtlich Ort und Eintrittszeit vorhersagbar. Nutzen Sie für die Warnung vor solchen Ereignissen zuvorderst die Wetterwarnungen des Deutschen Wetterdiensts.
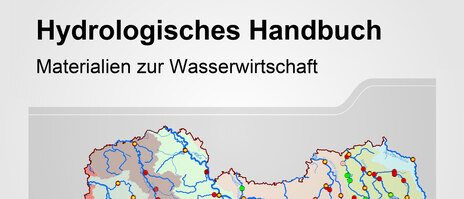
Weiterführende Informationen

Haben Sie noch Fragen?
Ansprechpartner Pegeldaten:
LHWZ-Meldezentrale
Telefon: 0351 8928-4563
E-Mail: LHWZ@lfulg.sachsen.de
Uwe Büttner
Telefon: 0351 8928-4512
E-Mail: LHWZ@lfulg.sachsen.de