Project reports on pollutants
Critical Load (ÖKO-Data, IOŚ-PIB)
Critical load (CL) quantify the input of pollutants which is tolerable for the ecosystem. The CL reflects the effectiveness of air pollution control measures. The general aim is to comply the CL and to estimate the possible risks on ecosystems against eutrophication and acidifying pollutant inputs. The combined consideration of climate projections, pollutants and environmental stress limits in the Polish-Saxon border region forms a new approach to the evaluation of risks and to control the effects of environmental protection measures. The report "Development of environmental exposure limits (critical loads) of various ecosystems in response to climate change and air pollutants in the Polish-Saxon border region" shows the results of the investigations on current and future environmental critical load involving climate scenarios to estimate the possible range of the trend. For calculation data of land use (CORINE2006), information on the extent of protected areas (NATURA2000), soil data (EDPS), deposition data and climate data for the study area were used.
Since the stress situation is negligible by inputs of acidifying substance, eutrophication due to nitrogen inputs is a high risk for ecosystems. Measures for air pollution control in recent decades lead to a higher number of ecosystems, where defined CL is not exceeded. Calculations of critical load under different climate scenarios and summarised evaluations of potential risks for the ecosystems show a higher impact of changing climate parameters on the critical load for protection against eutrophication than on the critical load for acid deposition. The reason is the opposite effect of climate dependent parameters in the mass balance equation in acidification. Considering the critical load for protection against eutrophication, however, all climate related changes work towards increasing sensitivity of ecosystems.
Overall, the present results on risk induced by eutrophication show a compensation of elemental (nutritive substances) and climatic changes. Due to reduced emission Critical Load are increasingly complied. However, there are decreasing load limits of protection against eutrophication for all investigated climate scenarios because of increasing temperatures and decreasing precipitation. The most significant effect in that context shows the RCP8.5 scenario 1st run.
Roughly, it can be assumed that only about half of mitigation of pollutants, achieved by measures on air pollution, has a positive Impact on the protection of ecosystems. The other half is compensated by the higher sensitivity of the ecosystem due to climate change. These effects should be considered in future clean air policy.
bld_KLAPS Fachbeiträge Schadstoffe_Bildergalerie Critical Load EN
")


Ozone (TU Dresden)
A subgoal of the project is the analysis of ozone pollution as a function of climatic factors in the project region. Therefore, chronological sequences and the influence of meteorological conditions were examined for ozone concentration. Data in hourly resolutions from 14 stations are available: six stations in Saxony, five stations in Brandenburg and three stations in Poland. One of the stations is a traffic-oriented station (Dresden-Nord), one is an industry-oriented station (Eisenhüttenstadt), eight stations are in urban background and four stations are in rural area.
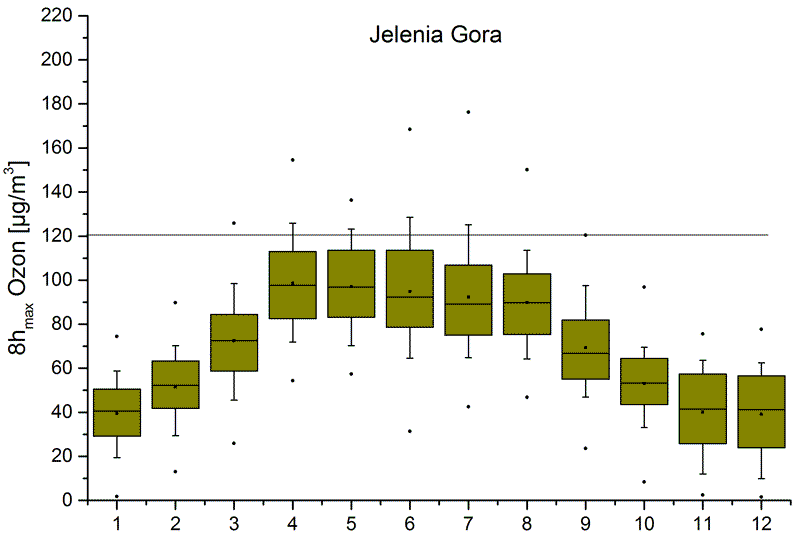
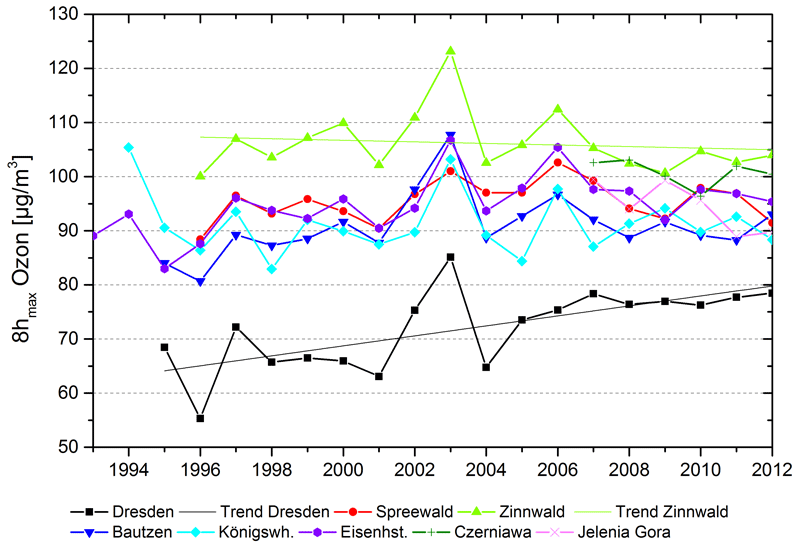
As a basic principle, it can be determined for the ozone pollution in the KLAPS project area that the lowest concentrations can be found at the station Zinnwald and highest at the station Dresden-Nord. All other stations are in the range between. In April, May, June, July and August much higher loads can be identified, while lower mean values and peak concentrations are observed in the winter months. Significant daily and weekly cycles can be determined at the station Dresden-Nord, which is a traffic station in urban area. Here, high concentrations of precursors were emitted and converted into ozone through photochemical processes. The most important precursors are oxides of nitrogen - nitrogen dioxide and nitric oxide - and volatile organic compounds without methane (NM VOC). With increasing distance of the station from the source of emitted precursors, differences in the diurnal cycle and also between the days of the week are dropping.
In addition to the presence of precursor substances the meteorological conditions are key parameters, affecting the evolution of ozone. Meteorological factors influence die dispersion of pollutants, the photochemical reactions, as well as large-scale transport. In the KLAPS project area the dependence of ozone concentration on meteorological variables shows the strongest correlations with global radiation, the daily maximum temperature and relative humidity.
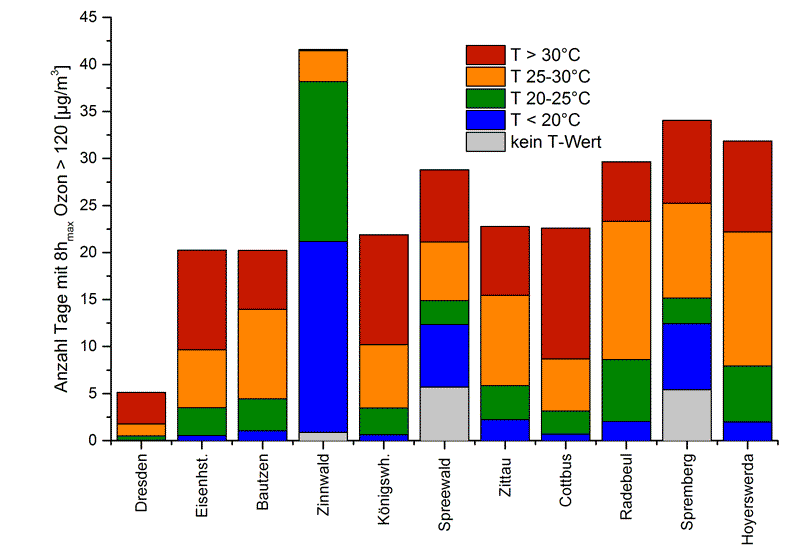
Future changes in climate will have a further impact on the ozone development. Not only meteorological conditions change, but also the emission situation concerning the precursors. Scientific studies refer to a possible increase of the ozone concentration in the summer months of the next decades, solely by the effects of climate change. Rising temperatures in combination with a rising global radiation are the driving factors for photochemical ozone formation, which will exacerbate the ozone pollution in the coming years, especially in areas with high concentrations of precursors. Because of the exceedances of the ozone limit of 120 µg/m³ (daily maximum of 8h-averages) at many stations in the KLAPS project area in recent years, especially on warm and hot days. A further increase of limit value violations due to the climatic trend can be expected. However, the decreasing nitric oxide concentrations counteract this trend.
The analysis of the mean diurnal variations, depending on certain weather pattern indices, show that summer air masses with a southerly inflow direction are characterised by the highest ozone concentrations, as these are associated with high temperatures. Especially those with south-easterly inflow direction have the highest daily maximum, as these are characterised by extremely dry and cloudless properties, what forces the photochemical formation of ozone. Weather conditions with high-pressure conditions in the middle atmosphere most frequently lead to exceedances of ozone limit values. Climate models show an increasing occurrence of this weather condition in the future.
The joint consideration of climate change and emission changes is important. The latter is crucial for the future development of the ozone concentrations. In this context, the importance of background levels, and thus the international action to reduce emissions is growing compared to regional and local measures. A further increase in global methane concentration and consequently the ozone background concentration may minimize the already achieved successes and targets for the reduction of nitrogen oxides and volatile organic compounds.
bld_KLAPS Fachbeiträge Schadstoffe_Bildergalerie Ozon en
 for Dresden - station close to traffic")

 for Jelenia Góra - station with urban background")
 of daily maximum of ozone (8-hour averages) for different stations")